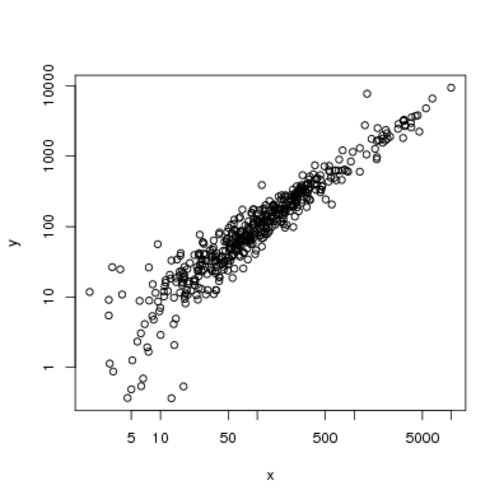
Figure 2.1:
Scatterplot of expression intensities for two samples.