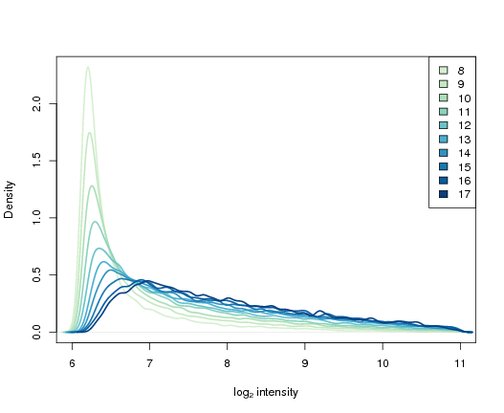
Figure 2.3:
Density plot of distributions of log_2-intensities from the CLL dataset grouped by GC content.