Chapter 7 Lawlor human pancreas (SMARTer)
7.1 Introduction
This performs an analysis of the Lawlor et al. (2017) dataset, consisting of human pancreas cells from various donors.
7.2 Data loading
7.3 Quality control
library(scater)
stats <- perCellQCMetrics(sce.lawlor,
    subsets=list(Mito=which(rowData(sce.lawlor)$SEQNAME=="MT")))
qc <- quickPerCellQC(stats, percent_subsets="subsets_Mito_percent",
    batch=sce.lawlor$`islet unos id`)
sce.lawlor <- sce.lawlor[,!qc$discard]colData(unfiltered) <- cbind(colData(unfiltered), stats)
unfiltered$discard <- qc$discard
gridExtra::grid.arrange(
plotColData(unfiltered, x="islet unos id", y="sum", colour_by="discard") +
scale_y_log10() + ggtitle("Total count") +
theme(axis.text.x = element_text(angle = 90)),
plotColData(unfiltered, x="islet unos id", y="detected",
colour_by="discard") + scale_y_log10() + ggtitle("Detected features") +
theme(axis.text.x = element_text(angle = 90)),
plotColData(unfiltered, x="islet unos id", y="subsets_Mito_percent",
colour_by="discard") + ggtitle("Mito percent") +
theme(axis.text.x = element_text(angle = 90)),
ncol=2
)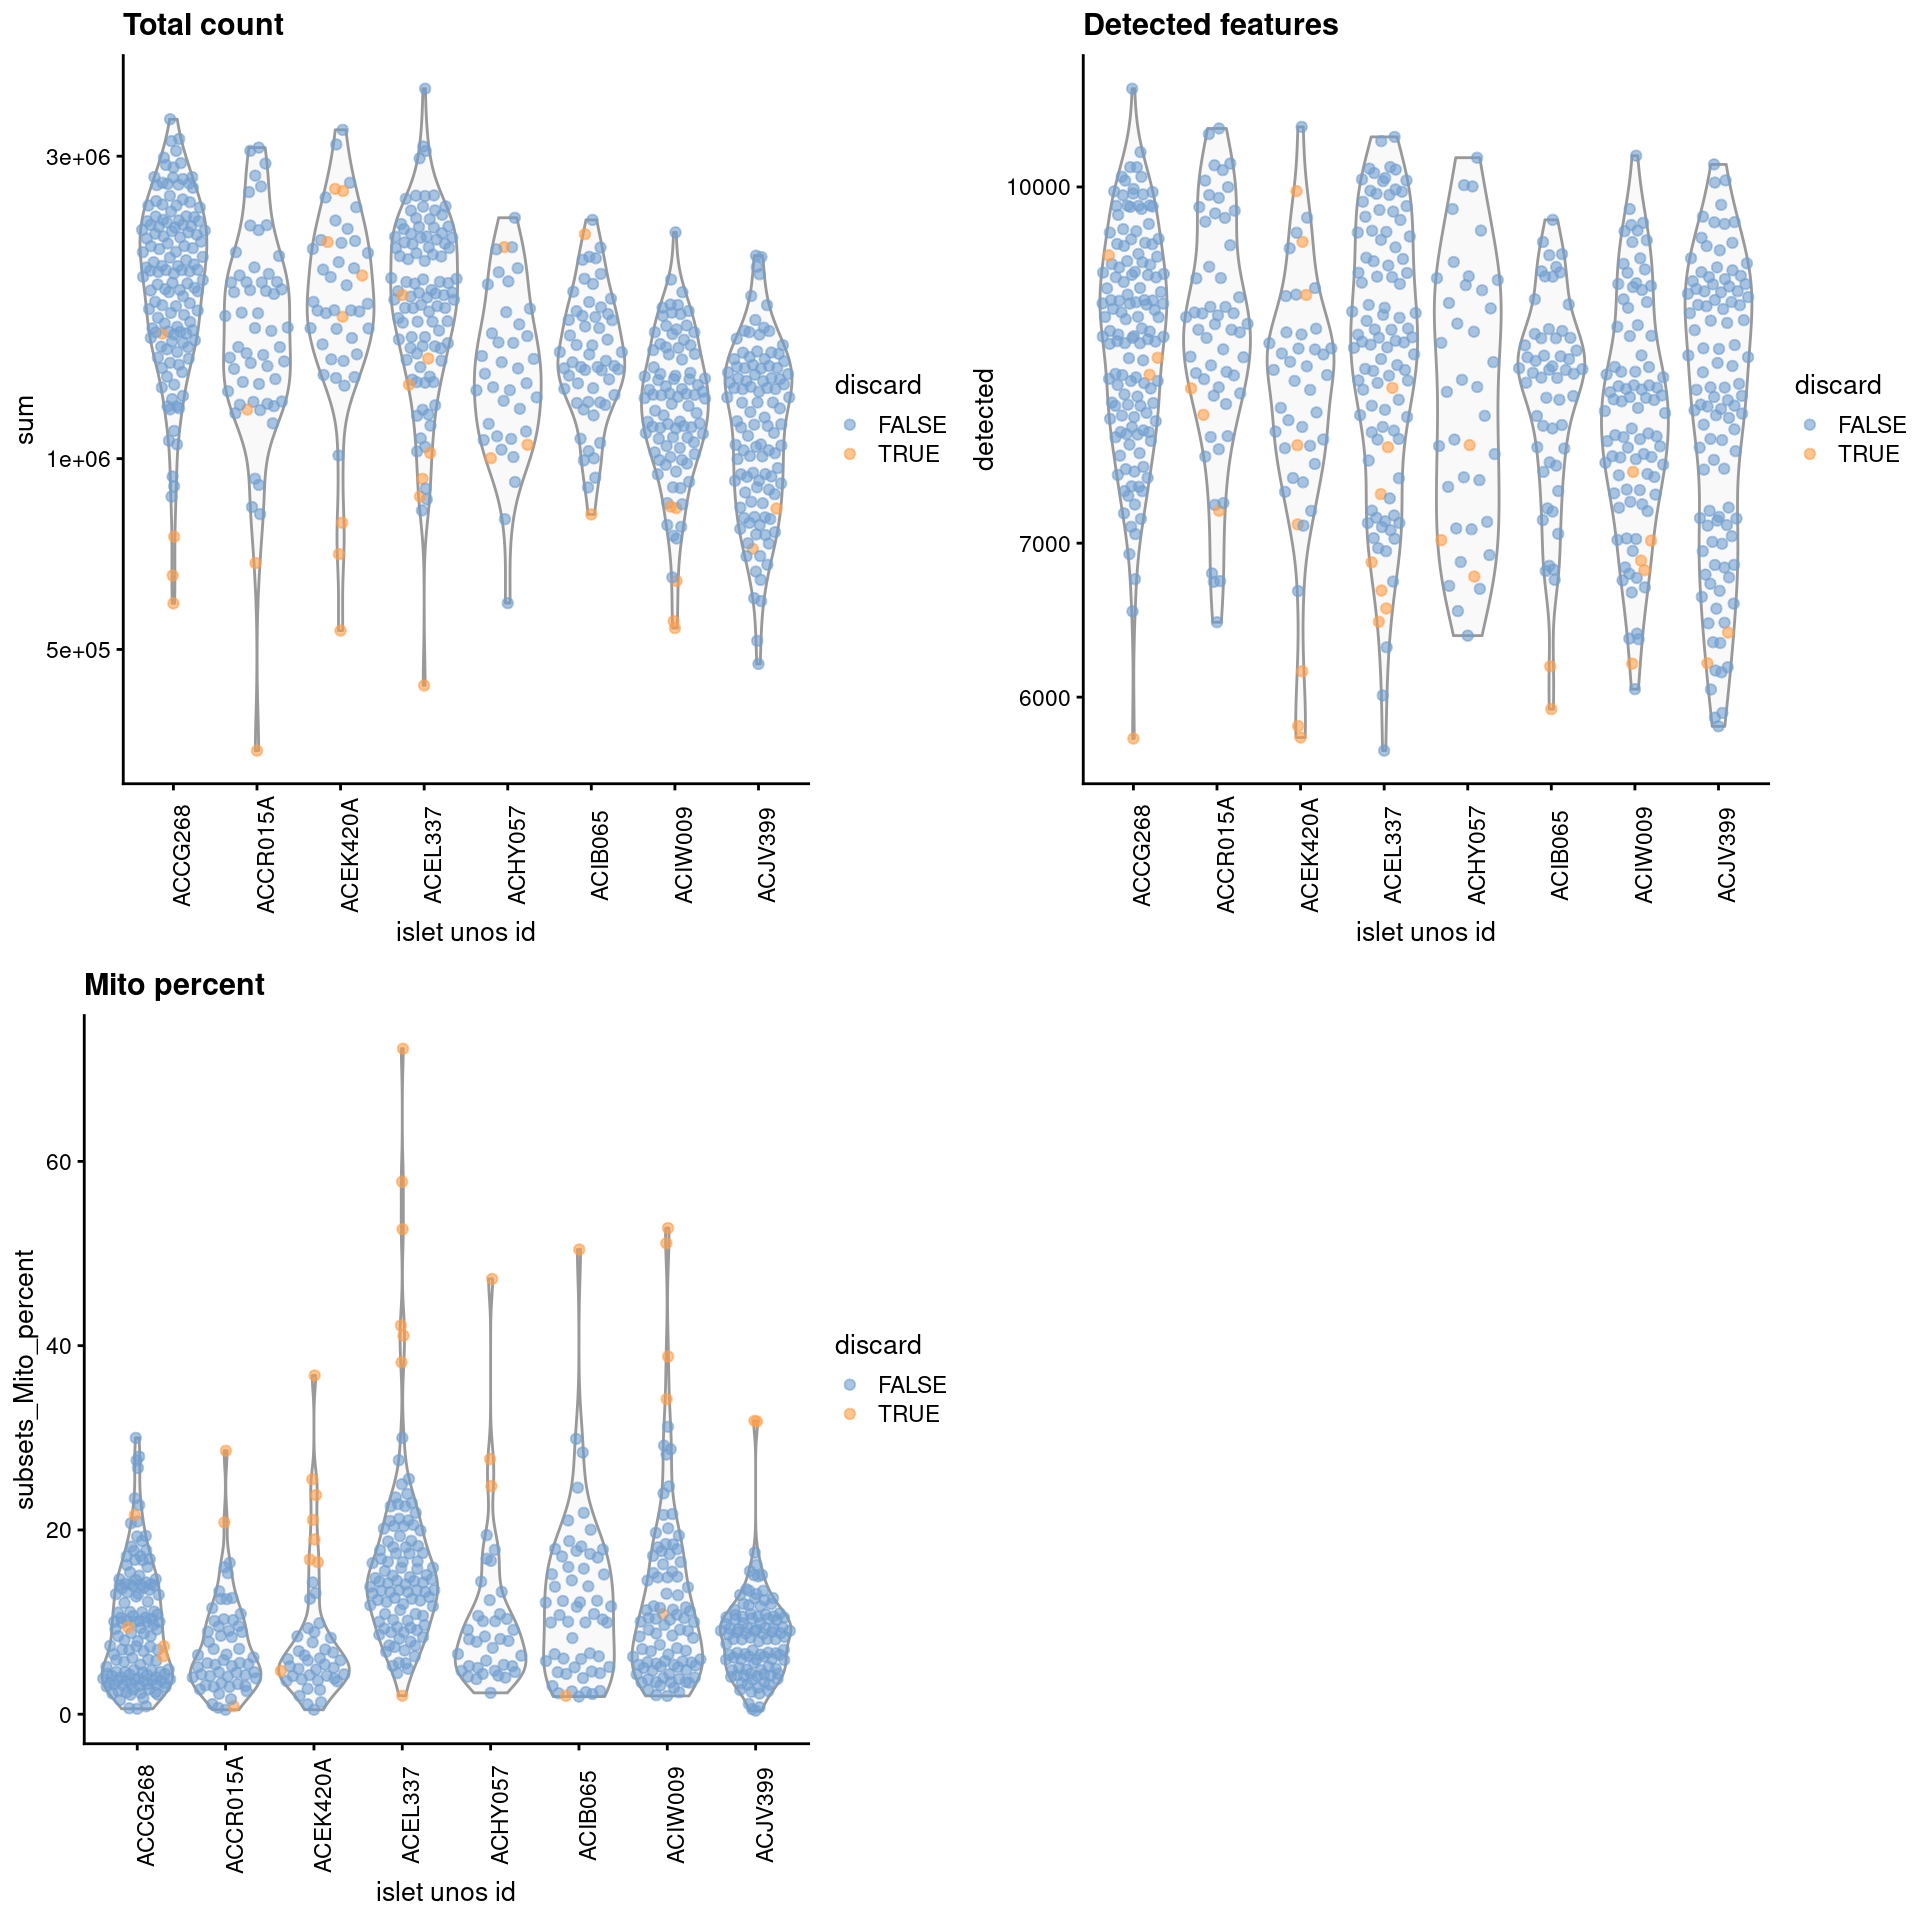
Figure 7.1: Distribution of each QC metric across cells from each donor of the Lawlor pancreas dataset. Each point represents a cell and is colored according to whether that cell was discarded.
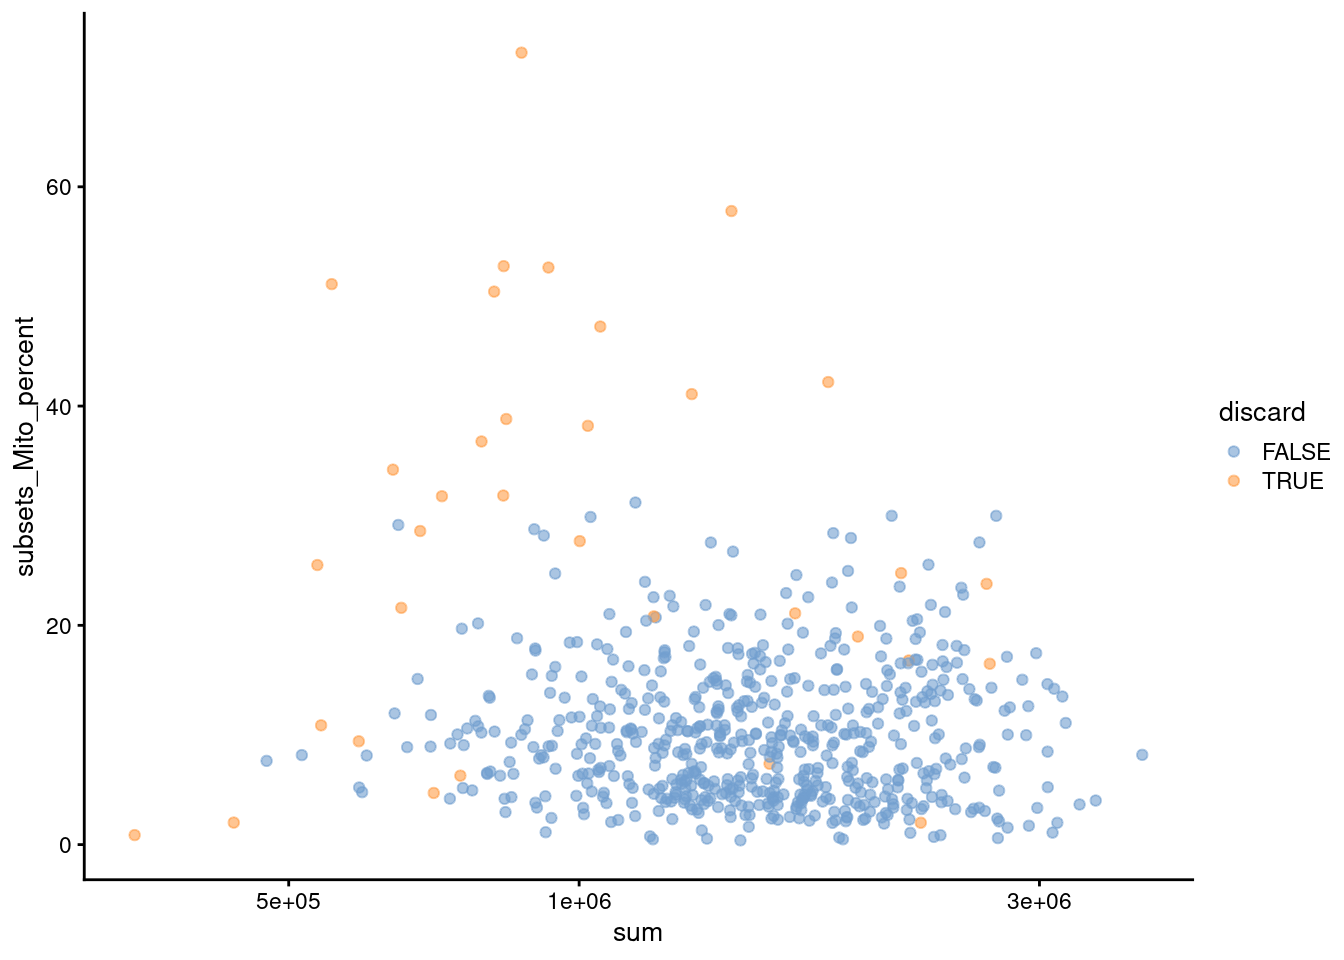
Figure 7.2: Percentage of mitochondrial reads in each cell in the 416B dataset compared to the total count. Each point represents a cell and is colored according to whether that cell was discarded.
##              low_lib_size            low_n_features high_subsets_Mito_percent
##                         9                         5                        25
##                   discard
##                        34
7.4 Normalization
library(scran)
set.seed(1000)
clusters <- quickCluster(sce.lawlor)
sce.lawlor <- computeSumFactors(sce.lawlor, clusters=clusters)
sce.lawlor <- logNormCounts(sce.lawlor)## Min. 1st Qu. Median Mean 3rd Qu. Max.
## 0.295 0.781 0.963 1.000 1.182 2.629plot(librarySizeFactors(sce.lawlor), sizeFactors(sce.lawlor), pch=16,
xlab="Library size factors", ylab="Deconvolution factors", log="xy")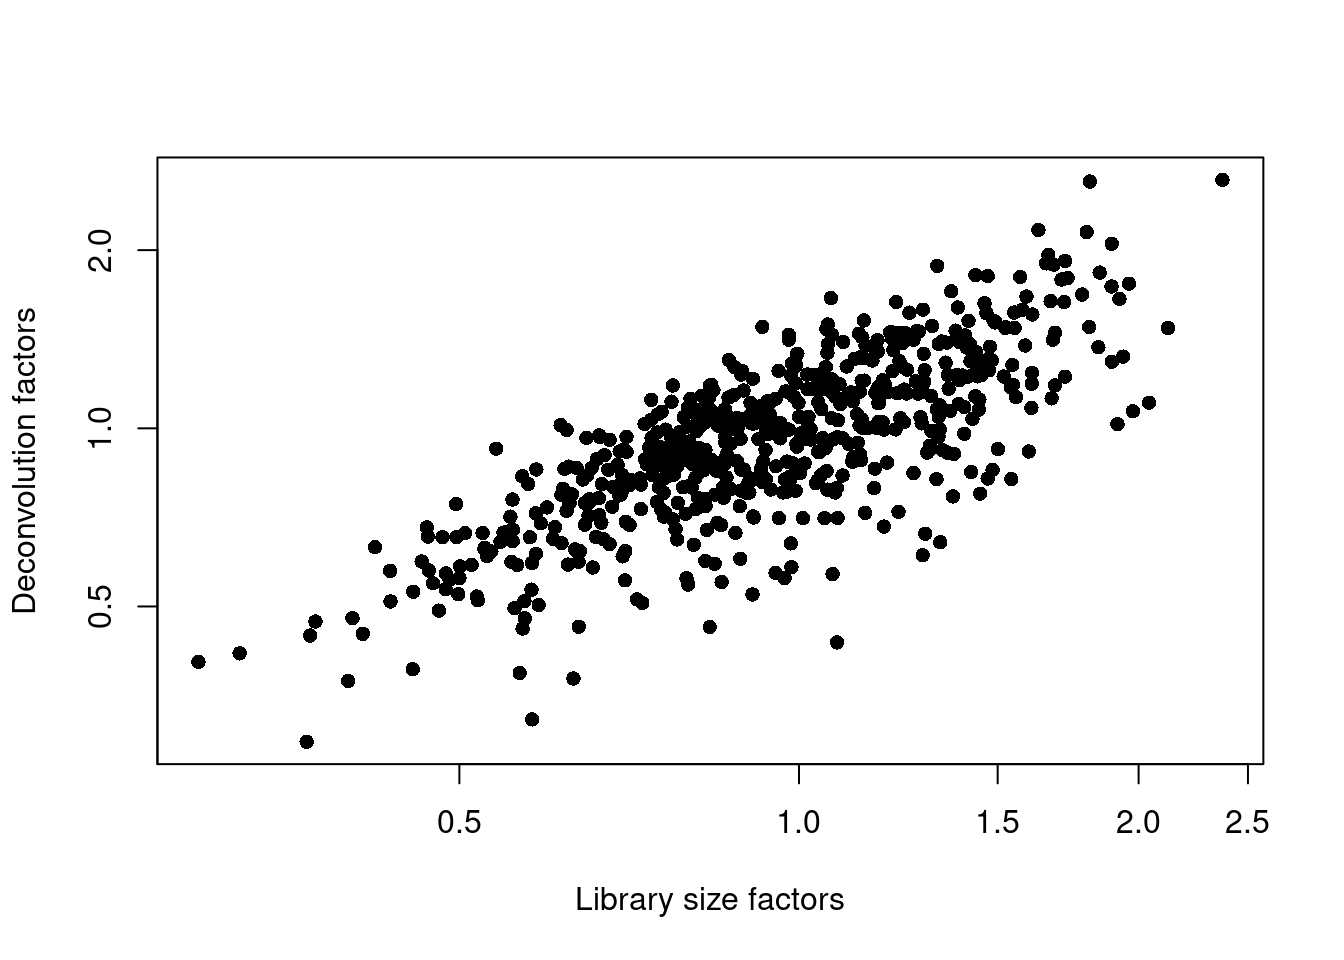
Figure 7.3: Relationship between the library size factors and the deconvolution size factors in the Lawlor pancreas dataset.
7.5 Variance modelling
Using age as a proxy for the donor.
dec.lawlor <- modelGeneVar(sce.lawlor, block=sce.lawlor$`islet unos id`)
chosen.genes <- getTopHVGs(dec.lawlor, n=2000)par(mfrow=c(4,2))
blocked.stats <- dec.lawlor$per.block
for (i in colnames(blocked.stats)) {
current <- blocked.stats[[i]]
plot(current$mean, current$total, main=i, pch=16, cex=0.5,
xlab="Mean of log-expression", ylab="Variance of log-expression")
curfit <- metadata(current)
curve(curfit$trend(x), col='dodgerblue', add=TRUE, lwd=2)
}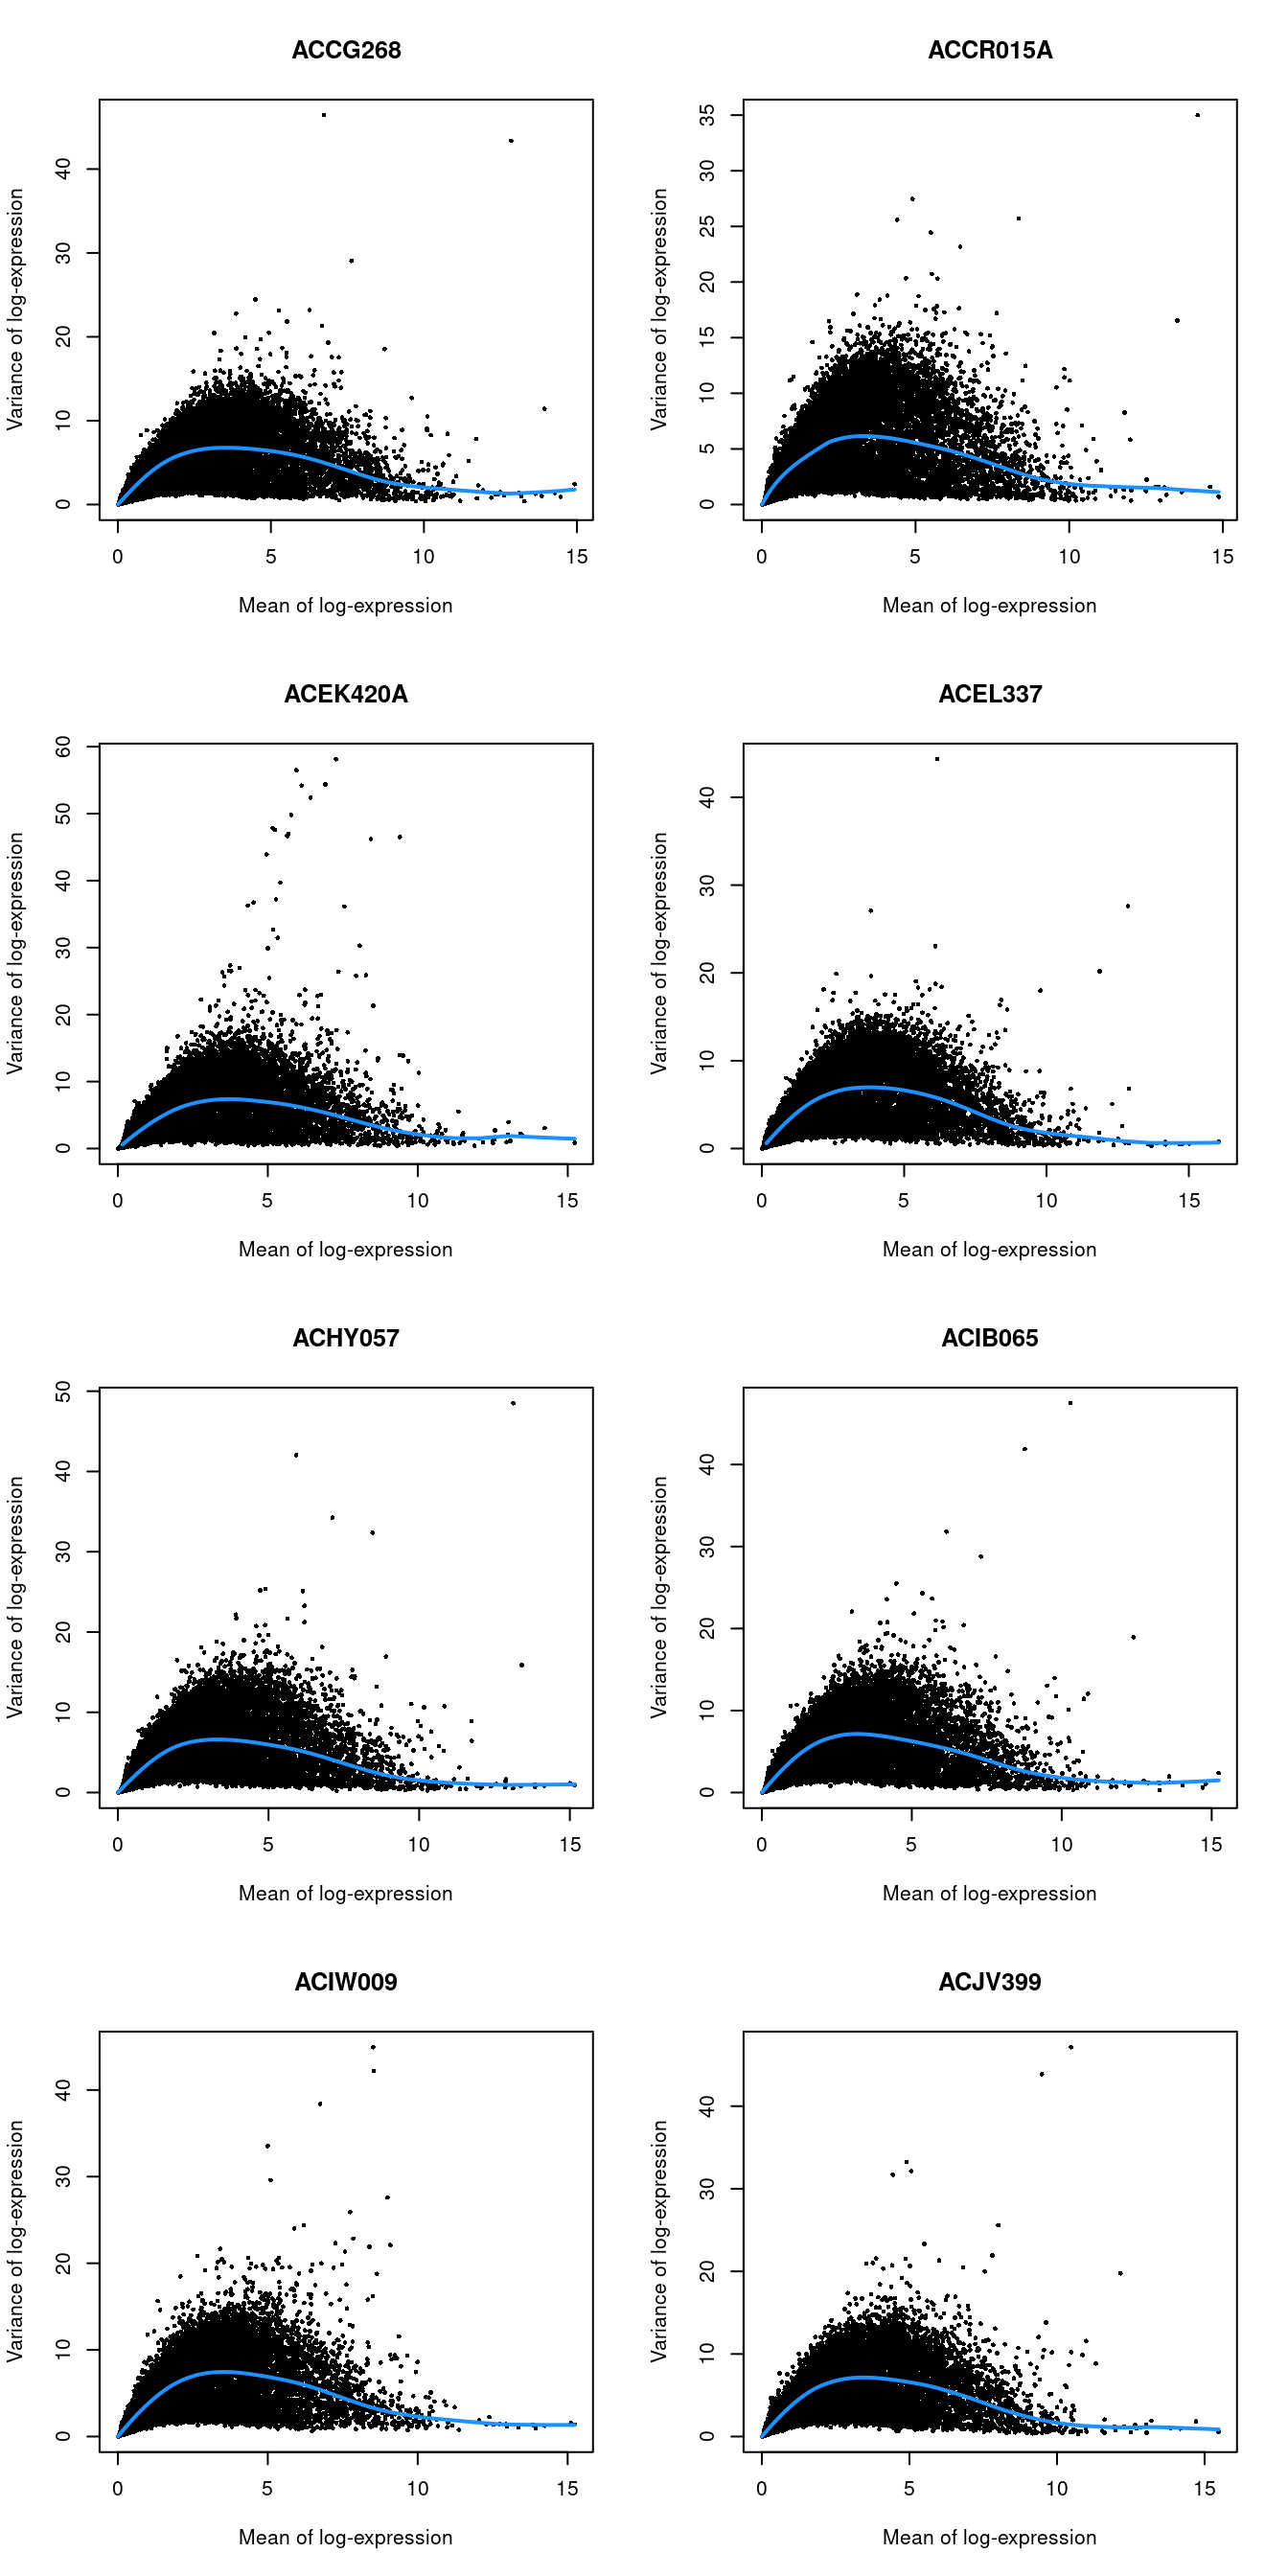
Figure 7.4: Per-gene variance as a function of the mean for the log-expression values in the Lawlor pancreas dataset. Each point represents a gene (black) with the mean-variance trend (blue) fitted separately for each donor.
7.6 Dimensionality reduction
7.7 Clustering
snn.gr <- buildSNNGraph(sce.lawlor, use.dimred="PCA")
colLabels(sce.lawlor) <- factor(igraph::cluster_walktrap(snn.gr)$membership)##
## Acinar Alpha Beta Delta Ductal Gamma/PP None/Other Stellate
## 1 1 0 0 13 2 16 2 0
## 2 0 1 76 1 0 0 0 0
## 3 0 161 1 0 0 1 2 0
## 4 0 1 0 1 0 0 5 19
## 5 0 0 175 4 1 0 1 0
## 6 22 0 0 0 0 0 0 0
## 7 0 75 0 0 0 0 0 0
## 8 0 0 0 1 20 0 2 0##
## ACCG268 ACCR015A ACEK420A ACEL337 ACHY057 ACIB065 ACIW009 ACJV399
## 1 8 2 2 4 4 4 9 1
## 2 14 3 2 33 3 2 4 17
## 3 36 23 14 13 14 14 21 30
## 4 7 1 0 1 0 4 9 4
## 5 34 10 4 39 7 23 24 40
## 6 0 2 13 0 0 0 5 2
## 7 32 12 0 5 6 7 4 9
## 8 1 1 2 1 2 1 12 3gridExtra::grid.arrange(
plotTSNE(sce.lawlor, colour_by="label"),
plotTSNE(sce.lawlor, colour_by="islet unos id"),
ncol=2
)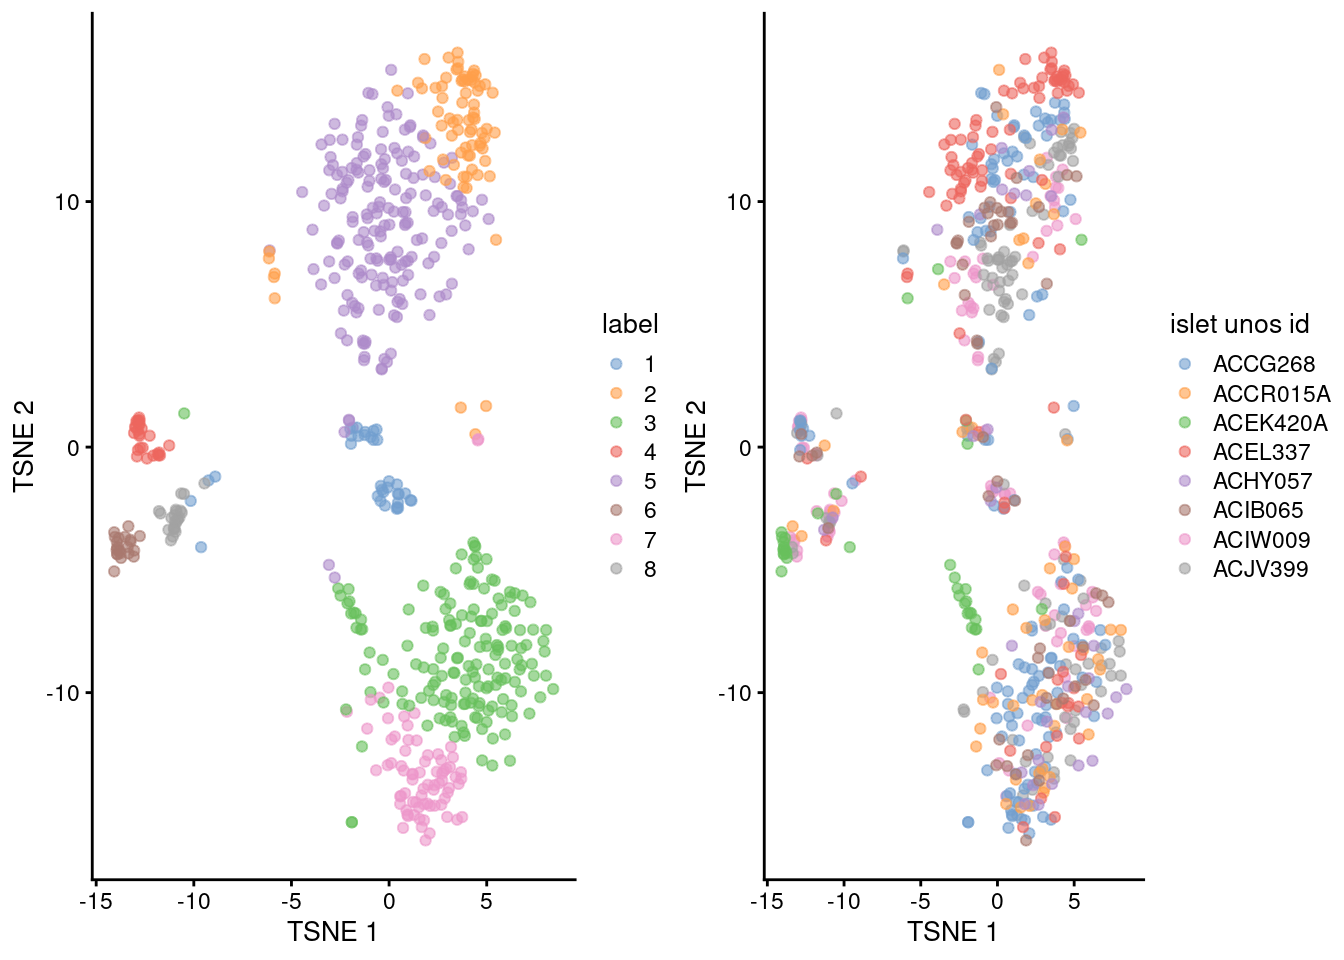
Figure 5.3: Obligatory \(t\)-SNE plots of the Lawlor pancreas dataset. Each point represents a cell that is colored by cluster (left) or batch (right).
Session Info
R version 4.1.0 (2021-05-18)
Platform: x86_64-pc-linux-gnu (64-bit)
Running under: Ubuntu 20.04.2 LTS

Matrix products: default
BLAS:   /home/biocbuild/bbs-3.13-bioc/R/lib/libRblas.so
LAPACK: /home/biocbuild/bbs-3.13-bioc/R/lib/libRlapack.so

locale:
 [1] LC_CTYPE=en_US.UTF-8       LC_NUMERIC=C
 [3] LC_TIME=en_US.UTF-8        LC_COLLATE=C
 [5] LC_MONETARY=en_US.UTF-8    LC_MESSAGES=en_US.UTF-8
 [7] LC_PAPER=en_US.UTF-8       LC_NAME=C
 [9] LC_ADDRESS=C               LC_TELEPHONE=C
[11] LC_MEASUREMENT=en_US.UTF-8 LC_IDENTIFICATION=C

attached base packages:
[1] parallel  stats4    stats     graphics  grDevices utils     datasets
[8] methods   base

other attached packages:
 [1] BiocSingular_1.8.0          scran_1.20.0
 [3] scater_1.20.0               ggplot2_3.3.3
 [5] scuttle_1.2.0               ensembldb_2.16.0
 [7] AnnotationFilter_1.16.0     GenomicFeatures_1.44.0
 [9] AnnotationDbi_1.54.0        AnnotationHub_3.0.0
[11] BiocFileCache_2.0.0         dbplyr_2.1.1
[13] scRNAseq_2.6.0              SingleCellExperiment_1.14.0
[15] SummarizedExperiment_1.22.0 Biobase_2.52.0
[17] GenomicRanges_1.44.0        GenomeInfoDb_1.28.0
[19] IRanges_2.26.0              S4Vectors_0.30.0
[21] BiocGenerics_0.38.0         MatrixGenerics_1.4.0
[23] matrixStats_0.58.0          BiocStyle_2.20.0
[25] rebook_1.2.0

loaded via a namespace (and not attached):
  [1] igraph_1.2.6                  lazyeval_0.2.2
  [3] BiocParallel_1.26.0           digest_0.6.27
  [5] htmltools_0.5.1.1             viridis_0.6.1
  [7] fansi_0.4.2                   magrittr_2.0.1
  [9] memoise_2.0.0                 ScaledMatrix_1.0.0
 [11] cluster_2.1.2                 limma_3.48.0
 [13] Biostrings_2.60.0             prettyunits_1.1.1
 [15] colorspace_2.0-1              blob_1.2.1
 [17] rappdirs_0.3.3                xfun_0.23
 [19] dplyr_1.0.6                   crayon_1.4.1
 [21] RCurl_1.98-1.3                jsonlite_1.7.2
 [23] graph_1.70.0                  glue_1.4.2
 [25] gtable_0.3.0                  zlibbioc_1.38.0
 [27] XVector_0.32.0                DelayedArray_0.18.0
 [29] scales_1.1.1                  edgeR_3.34.0
 [31] DBI_1.1.1                     Rcpp_1.0.6
 [33] viridisLite_0.4.0             xtable_1.8-4
 [35] progress_1.2.2                dqrng_0.3.0
 [37] bit_4.0.4                     rsvd_1.0.5
 [39] metapod_1.0.0                 httr_1.4.2
 [41] dir.expiry_1.0.0              ellipsis_0.3.2
 [43] pkgconfig_2.0.3               XML_3.99-0.6
 [45] farver_2.1.0                  CodeDepends_0.6.5
 [47] sass_0.4.0                    locfit_1.5-9.4
 [49] utf8_1.2.1                    tidyselect_1.1.1
 [51] labeling_0.4.2                rlang_0.4.11
 [53] later_1.2.0                   munsell_0.5.0
 [55] BiocVersion_3.13.1            tools_4.1.0
 [57] cachem_1.0.5                  generics_0.1.0
 [59] RSQLite_2.2.7                 ExperimentHub_2.0.0
 [61] evaluate_0.14                 stringr_1.4.0
 [63] fastmap_1.1.0                 yaml_2.2.1
 [65] knitr_1.33                    bit64_4.0.5
 [67] purrr_0.3.4                   KEGGREST_1.32.0
 [69] sparseMatrixStats_1.4.0       mime_0.10
 [71] biomaRt_2.48.0                compiler_4.1.0
 [73] beeswarm_0.3.1                filelock_1.0.2
 [75] curl_4.3.1                    png_0.1-7
 [77] interactiveDisplayBase_1.30.0 statmod_1.4.36
 [79] tibble_3.1.2                  bslib_0.2.5.1
 [81] stringi_1.6.2                 highr_0.9
 [83] bluster_1.2.0                 lattice_0.20-44
 [85] ProtGenerics_1.24.0           Matrix_1.3-3
 [87] vctrs_0.3.8                   pillar_1.6.1
 [89] lifecycle_1.0.0               BiocManager_1.30.15
 [91] jquerylib_0.1.4               BiocNeighbors_1.10.0
 [93] cowplot_1.1.1                 bitops_1.0-7
 [95] irlba_2.3.3                   httpuv_1.6.1
 [97] rtracklayer_1.52.0            R6_2.5.0
 [99] BiocIO_1.2.0                  bookdown_0.22
[101] promises_1.2.0.1              gridExtra_2.3
[103] vipor_0.4.5                   codetools_0.2-18
[105] assertthat_0.2.1              rjson_0.2.20
[107] withr_2.4.2                   GenomicAlignments_1.28.0
[109] Rsamtools_2.8.0               GenomeInfoDbData_1.2.6
[111] hms_1.1.0                     grid_4.1.0
[113] beachmat_2.8.0                rmarkdown_2.8
[115] DelayedMatrixStats_1.14.0     Rtsne_0.15
[117] shiny_1.6.0                   ggbeeswarm_0.6.0
[119] restfulr_0.0.13
References
Lawlor, N., J. George, M. Bolisetty, R. Kursawe, L. Sun, V. Sivakamasundari, I. Kycia, P. Robson, and M. L. Stitzel. 2017. “Single-cell transcriptomes identify human islet cell signatures and reveal cell-type-specific expression changes in type 2 diabetes.” Genome Res. 27 (2): 208–22.